Key Points
- Pfizer’s Covid-19 vaccine EUA was granted based on early results from an interim analysis from the vaccine’s phase III clinical trial
- Deep examination of the results from this analysis suggest that the vaccine has an unfavourable profile with respect to severe events, with an increment of two to three cases of serious adverse events for every single case reduction of severe Covid-19
- The samples used for the analyses were selected post-hoc by unblinded investigators and did not follow protocol definitions, which implies possible biases, inflating both vaccine safety and efficacy assessments
Abstract
We demonstrate severe flaws in the procedure of approving Pfizer’s Covid-19 vaccine based on data from the vaccine’s phase III clinical trial. Specifically, we show that according to the official data, at the time the FDA granted the vaccine Emergency Use Authorization (EUA), it had already caused more harm than good: for every reduction of a single severe Covid-19 case, an increment of two to three serious adverse events (SAEs) had been observed in the trial’s vaccine arm. This alone, we believe, should have prevented the FDA from approving this vaccine without further data. In addition, we show significant violations and protocol deviations in the conduct of the trial, which allowed Pfizer to bias the results. In particular, the sample used for the main safety analysis was based on an arbitrary inclusion criteria, and the data cutoff date did not follow the protocol timing. As such, this sample may not be considered a random sample, as required for statistical inference. This implies that the reported results are unlikely to represent a realistic risk-benefit trade-off; in reality, it may be that both the risk is higher and the benefit lower than that reported by Pfizer.
Introduction
It is well accepted that every medical intervention (including vaccination) may cause several effects, some of which are beneficial and some harmful. It is estimated [1] that of those candidate drugs which have passed preclinical phases and started human clinical trials, about 8% will eventually be approved. In most cases, such drugs are not approved due to the fact that they demonstrate unfavourable risk-benefit trade-offs, causing more harm than good. Thus, there is a burden of proof on the manufacturer to show that a certain medical intervention causes more good than harm in certain conditions, where the default assumption is to the contrary. Such a proof should rely on appropriate causal inference methodologies in order to assess the overall likelihood of both positive (efficacy) and negative (safety) effects caused by the intervention. The main way to demonstrate such a proof – and this is required by most regulators, including the FDA – is by conducting so-called phase III clinical trials. Such trials are intended to provide convincing evidence of the efficacy and safety of the intervention.
In order to eliminate possible biases in phase III clinical trials (whether these occur naturally or are intentionally/unintentionally introduced by the investigators), the FDA typically requires that:
(a) A sufficiently large population of participants should be followed for a sufficiently long period of time after being given the treatment.
(b) The trial should be a randomised, placebo-controlled trial (RCT): in addition to the participants who receive the treatment, the trial should also follow a placebo-treated control group. Participants should be assigned randomly to either the treatment group or the control group.
(c) It should be a double-blinded trial: neither participants nor investigators should know (before the trial has ended) which participant got the treatment and which got a placebo.
(d) A protocol describing the conduct of the trial and a statistical analysis plan (SAP) should be approved prior to running the trial, listing among other things, the study’s safety and efficacy endpoints, and how these endpoints will be measured.
Pfizer’s phase III clinical trial C4591001 of their Covid-19 vaccine is indeed one of the largest clinical trials conducted to date, with over 40,000 participants recruited [2]. Its official estimated completion date is February 2024, with follow-up of the majority of participants for at least two years. However, in contrast to the common regulatory procedure, Pfizer’s Covid-19 vaccine was approved prior to the completion of its phase III clinical trial. In December 2020, the FDA granted the vaccine an Emergency Use Authorization (EUA) [3] on the basis of a preliminary interim analysis [4, 5] applied to data collected over three and a half months between 27 July and 14 November 2020. A final approval [6] was granted to the vaccine in August 2021 on the basis of a second interim analysis [7] that covered additional data collected through 13 March 2021, as well as some real-world post-marketing data collected from vaccinated populations under the EUA.
Due to the EUA granted after the first interim analysis, Pfizer amended the vaccine’s trial plan, arguing that it would be unethical to withhold the treatment from participants in the placebo arm in places where it was already available to the public. This led to a gradual unblinding process, in which the treatment type was revealed to the participants, and placebo-treated participants were offered the vaccine. The de facto implication of this unblinding process was the termination of the controlled study after only a few months of follow-up, and the prevention of a long-term objective comparison between vaccinated participants and a control group. The results reported in the second interim analysis were obtained after this unblinding process.
In this work, we review the reports provided by Pfizer to the FDA for the trial’s first interim analysis. We show that, even according to the official numbers, the vaccine has been demonstrated to have an overall unfavourable effect when considering severe illness. Moreover, we point out some significant breaches in the conduct of the trial, which imply that it is more than likely that those official numbers do not represent the true effects of the product, which may in fact be even more harmful than reported.
Analysis of the raw results
A detailed report of the November 2020 interim analysis of Pfizer’s Covid-19 vaccine clinical trial is given in an official document produced by Pfizer titled “Vaccines and Related Biological Products Advisory Committee Briefing Document” (referred to below as the VRBPAC Briefing Document), available on the FDA’s website [5]. The following facts can be ascertained from this document and from the trial’s protocol [8].
- The protocol distinguishes between Covid-19 and severe Covid-19 cases (pages 56-57, see Appendix Figure A1 below). Similarly, the protocol distinguishes between Adverse Events (AEs) and Serious Adverse Events (SAEs, pages 125-127, see Appendix Figure A2). Severe Covid-19 and SAEs are, respectively, the highest severity levels of SARS-CoV-2 infections and adverse events, with comparable severity per protocol definition. Severe Covid-19 cases are the main reason health authorities worldwide have taken extreme steps in an attempt to reduce disease prevalence. On the other hand, SAEs are the main safety concerns associated with vaccine risk assessments.
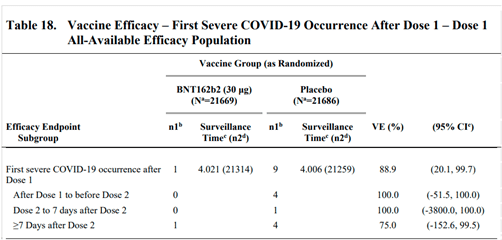
- Table 18 on page 67 of the VRBPAC Briefing Document [5] (Figure 1 here) summarises the counts of severe Covid-19 cases observed in the data. It lists a total of one case in the vaccine arm and nine cases in the placebo arm, i.e. a reduction of eight severe Covid-19 cases among vaccinated participants.
- Table 8 on page 46 of the VRBPAC Briefing Document [5] summarises the safety data. The table presents the number of participants in each study arm who experienced AEs of particular classifications. It is possible that an individual might have experienced multiple AEs of the same classification, which would not be expressed in the table. According to this table, 126 and 111 participants, in the vaccine and placebo arms respectively, experienced SAEs. The observed increment in the vaccine arm is thus 15 cases.
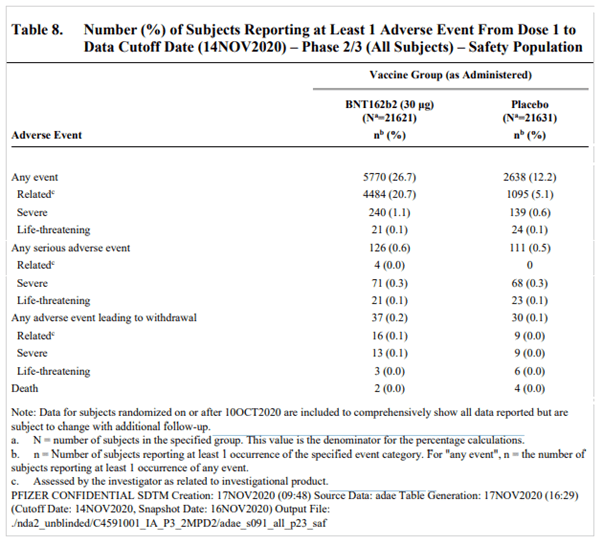
As can be seen from Pfizer’s own data above, while the observed reduction in severe Covid-19 cases among the vaccinated was eight cases, the increase in SAEs was 15 – about double the number. As this was a large-scale randomised control trial, the observed differences between vaccinated and unvaccinated populations suggest a causal relationship between the vaccine and the SAE. This implies that in a large population of vaccinated people, for every reduction of a severe Covid-19 case due to the vaccine, an increment of about two SAEs could be expected. In this sense, the trial’s results indicate that the vaccine causes more harm than good when it comes to a risk-benefit assessment of severe illness.
It is true that an accurate estimate of the overall effect of the vaccine cannot be based on these relatively small numbers. Nevertheless, the default (null) hypothesis, which should be used to evaluate those results, is that the treatment is more harmful than beneficial, which is the typical case for experimental treatments. This null hypothesis should only be rejected if, based on the trial data, there is clear statistical evidence that the hypothesis does not hold. Yet here we can see not only that the results do not contradict the null hypothesis, but that they in fact support it. In light of these results, it is unclear what arguments the FDA used as the basis for granting an EUA for the Covid-19 vaccine.
A deeper dive
In this section we provide additional arguments to suggest that it is likely that the official numbers reported by Pfizer actually underestimate the risk and overestimate the benefit of the vaccine. We do so by taking a further look at the clinical trial’s protocol, comparing the planned analyses to those actually conducted, and showing that the analyses presented were chosen in a post-hoc manner by unblinded investigators, in a way that allowed them to bias the results towards the artificial appearance of increased safety and efficacy.
“Blinding”, in the context of placebo-controlled clinical trials, refers to the practice of not revealing the identities of those receiving the treatment or the placebo for the full duration of the trial. This eliminates possible sources of bias, which may result in the observed effects of the treatment to deviate from its actual effects. For example, it is well known that some patients who believe they have been treated with a drug, even if they were not, will report a greater improvement in their clinical state than patients who believe they were not treated. Similarly, an investigator who knows which of the patients received the treatment and which got a placebo may unconsciously assess differently the clinical states of two patients with similar indications but different treatments. For phase III clinical trials, blinding typically applies to the trial participants, care providers, investigators, and outcomes assessors. This practice is known as “quadruple blinding”, but for historical reasons the term “double blind” is more commonly used. Certain small operational and safety monitoring teams generally remain unblinded during the trial, but such teams are not responsible for drawing conclusions regarding the trial’s endpoints.
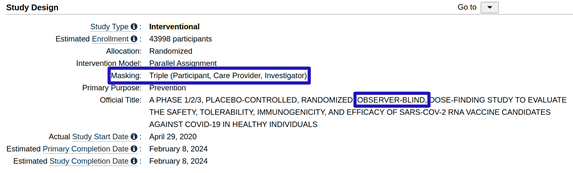
Instead of being defined as “double blind”, Pfizer’s clinical trial C4591001 is referred to in its description as an “observer blind” study (see Figure 3 below, taken from the study’s entry at clinicaltrials.gov [2]). This term usually refers to a study design in which participants and care providers who are in direct contact with the participants are blinded to the assignment of the treatment , yet other investigators may be unblinded to this information.
An advanced search in clinicaltrials.gov for the term “observer blind”, restricted to phase III clinical trials, resulted in 145 entries (as of 16 September 2022). A similar search for the term “double blind” resulted in 13,274 entries. That is, among phase III studies, which include blinding status in their textual description on clinicaltrials.gov, only about 1% are defined as “observer blind”, whereas 99% are defined as “double blind”.
A more detailed description of the blinding policy is included under the “Masking” item in the “Study Design” section. Here, the stated blinding policy is “triple blind”, which includes the participants, care providers, and investigators, but excludes outcome assessors – the personnel responsible for confirming the occurrence of Covid-19 from symptoms, and to confirm the occurrence of AEs and assess their severity. It is not clear if outcome assessors were in fact unblinded, as the protocol in Section 6.3.3 [8] (page 49), which deals with blinding, does not discuss this group. Nevertheless, the protocol indicates that at least some of the investigators on behalf of Pfizer were unblinded during the trial. This is evident from, for instance, the last sentence of Section 9.5 (page 114, see Appendix Figure A3 below) that indicates that the interim analyses will be conducted by unblinded investigators. Similarly, the NEJM publication [4] of the trial stated that all authors (who were mostly Pfizer’s investigators) were exposed to the complete set of data for that publication (Figure 4).
Figure 4: excerpts from the trial’s protocol [8] (upper) and NEJM publication of the second interim analysis [4] (lower), showing that investigators responsible for the interim analysis were unblinded.
The importance of blinding and other guidelines in the context of a sound drug approval process cannot be overstated. For example, if the analyses presented to the regulator are not predefined in the protocol but rather chosen in a post-hoc manner after the trial’s data has been revealed to those with an interest in its outcomes, it allows the investigators and/or sponsors to choose from many possible analyses and data slices those which artificially improve the appearance of both treatment efficacy and safety. The implied cost-benefit assessment of the treatment resulting from such analyses might deviate significantly from the actual effect of the treatment on the target population.
We now examine the specific analyses reported by Pfizer and compare them to the protocol. In addition to Table 8 in the VRBPAC Briefing Document [5], which was mentioned in the previous section, Pfizer provided two additional tables with AE counts: Tables 6 and 7 (pages 34-45, Figure 5 below). Tables 6-8 differ in terms of the subsets of participants referred to, as well as the follow-up time for each participant:
- Table 6 considers a population of about 38,000 participants (a so-called Safety Population), and follows each participant from the first dose to one month after the second dose (i.e. a total of seven weeks). It is worth noting that for some of these participants, the follow-up time was actually shorter than one month after the second dose: for 2% it was less than two weeks and for 6.4% it was between two and four weeks (Table 3 on page 30 of the VRBPAC Briefing Document [5]).
- Table 7 considers a subset of the Safety Population consisting of about 19,000 participants. It excludes those who had not been followed up for two months after their second dose. Each participant was followed from the first dose to the data cutoff date of 14 November 2020. The follow-up time per participant varied depending on the day of recruitment to the study.
- Table 8 considers all enrolled participants (about 43,000) and follows each participant from the first dose to the data cutoff date of 14 November 2020. The follow-up time per participant varied, and some participants in this group did not get the second dose.
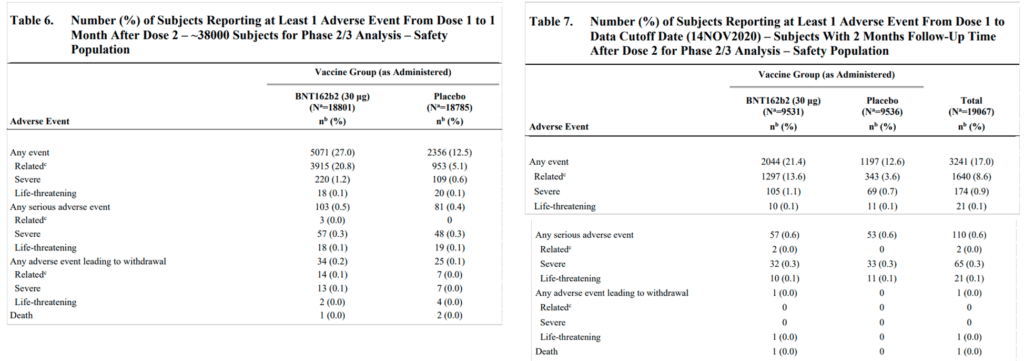
Figure 5: Tables 6 and 7 in the VRBPAC Briefing Document [5] (pages 43-45)
Among Tables 6-8 in the VRBPAC Briefing Document [5], only Table 6 resembles, to some extent, an analysis specified in the protocol (“Safety data through 1 month after Dose 2”, third bullet in protocol’s Section 9.5.1, see Appendix Figure A3 here). The analyses presented in Tables 7 and 8 are not mentioned in the protocol. Coincidentally or not, Table 6 implies the greatest safety concerns among the three tables, with an increment of 22 SAEs in the vaccine arm during a seven-week period. This is nearly three times the eight severe Covid-19 case reductions in the entire population and study period.
While the one-month follow-up period referred to in Table 6 is indeed specified in the protocol for the interim safety analysis, in other respects the data subset to which Table 6 refers seems completely arbitrary. The Safety Population mentioned in the table’s title is defined as “all Phase 2/3 participants (N~38,000) who received BNT162b2 or placebo who had a median follow-up time of 2 months after Dose 2” (VRBPAC Briefing Document [5] page 18, third bullet). This definition does not provide a clear inclusion/exclusion criterion per participant. Effectively, the Safety Population was the subset of participants who were recruited by 9 October 2020, as can be learned from the “Participants” paragraph in the “Results” section in [4]. As the table counts AEs that occurred up to one month after dose 2, the natural population to consider would be those participants who, by the cutoff date, had been followed up at least one month after the second dose. Taking a different, vaguely-defined subset – that of participants with a median of a two-month follow-up after dose 2 – seems questionable, in particular since no such definition of a Safety Population or any other population is mentioned in the protocol.
In addition, the specific data cutoff date of 14 November 2020 doesn’t match any of the conditions listed in the protocol for conducting any of the safety or efficacy analyses. In relation to the triggering of efficacy analyses, Section 9.5.1 in the protocol (Appendix Figure A3 here) lists several thresholds for the total number of Covid-19 cases in the trial, the maximum of which is 120 cases. Nevertheless, according to Table 11 on page 57 of the VRBPAC Briefing Document [5], by the data cutoff date there were 325 Covid-19 cases in the trial (50 in the vaccine arm and 275 in the placebo arm). For triggering the safety analysis, the same protocol section requires that at least 6,000 participants with at least one month of exposure after dose 2 will be eligible to be included in this analysis. In Section 6.3.1.1 in the VRBPAC Briefing Document [5] (page 30) it is stated that “Duration of follow up was ≥1 month post Dose 2 for 91.6% of participants”, referring to those ~38,000 Safety Population participants. This results in over 34,000 participants with at least one month of follow-up by the data cutoff date. Thus, the conditions for both efficacy and safety analyses were met long before the chosen data cutoff date. Pfizer’s unblinded statistical team could have chosen one among many earlier dates, or in fact any later date, as a data cutoff date.
In other words, it seems that the sample used for the interim analysis was not a random sample, but rather one which Pfizer was able to choose among many alternatives. Having a random sample is a required condition for drawing statistical conclusions. Naturally, there is some random variation in the observed parameters of the study over time, where on any given day the SAE and severe Covid-19 counts in either the vaccine or placebo arm may be higher or lower than their average values (normalised by person-days). Such variations also occur if different criteria are applied in order to restrict the subset of participants being considered in the analyses. In the relatively small number of cases observed in the trial (in particular that of ten severe Covid-19 cases), small changes in the counts may have significant effects on the statistical estimates of the phenomena. Therefore, choosing different inclusion criteria for participants in each analysis, or choosing a different data cutoff date, might result in significantly different efficacy and safety assessments of the treatment.
Pfizer was able to choose, in a post-hoc manner, which analysis among many to present, and in fact they did so. Pfizer could have exploited this to bias the trial results towards conclusions that supported their goals. While this alone does not prove that any data biassing took place, it raises suspicion that manipulation did occur. This suspicion increases given Pfizer’s massive conflict of interest in this case.
In the Appendix Section: Statistical significance of SAE counts, we analyse the statistical significance of the observed increment in SAEs among vaccinated participants in the trial. We show that even if one accepts Pfizer’s report as is, and regards its data as a random sample, the numbers provide strong statistical evidence for higher SAE rates among vaccinated people.
Discussion
The Covid-19 pandemic is a formative event, in which unprecedented global efforts were made to confront a virus outbreak. Politicians, health officials, and media channels repeated the claim that “the vaccines are safe and effective”, promoted the narrative that vaccination was the only way out from the pandemic, and urged people to get vaccinated.
Governments applied aggressive means such as vaccine passports to nudge their citizens to get vaccinated. Nevertheless, many voices within the scientific community and elsewhere questioned this narrative and the corresponding means. In contrast to the deep conviction about the desirability of these vaccines expressed in mainstream media, many have pointed out flaws in the way they were rushed through the development cycle and approved by the regulators.
Here we analyse data from the November 2020 interim analysis performed by Pfizer during their Covid19 vaccine phase III clinical trial. We show that the raw numbers, as provided by Pfizer, suggest that the vaccine causes about two to three SAEs per single case of severe Covid19 reduction. We also present (in the Appendix) statistically strong evidence that the vaccine indeed increases SAE rates. Assuming that SAEs and severe Covid-19 cases are clinically comparable, and that the main purpose of the treatment is to reduce the number of severe cases, the trial has demonstrated that the vaccine causes more harm than good.
Furthermore, we show that Pfizer’s analyses deviate from the trial’s protocol in at least two important respects: (a) the timing of the data cutoff date for the interim analysis does not follow the timing defined in the protocol, and (b) the inclusion criteria for participants in the safety analysis are arbitrary. These are severe breaches of the standard drug approval process, as they allow for an artificial inflation of efficacy assessments whilst hiding potential safety signals.
It was on the basis of these already unfavourable, and possibly biassed results that the FDA granted Pfizer’s Covid-19 vaccine an EUA. This provided Pfizer with an excuse to effectively terminate the double-blinded and controlled period of the vaccine’s phase III clinical trial. This in turn guaranteed that no long-term safety and efficacy follow-up, which adhered to acceptable standards for drug approval procedures, would ever be conducted. This drastic modification in the conduct of an ongoing trial calls into question all additional reported results from the trial, such as the second interim analysis results, which were used for the final vaccine approval by the FDA.
All these irregularities, we believe, demand the reevaluation of the trial results, the conclusions drawn from them, and the global and local vaccine-related policies that are based on these conclusions.
Acknowledgments
The author is grateful for the many valuable comments and aid provided throughout the development of this manuscript by members of the Israeli Public Emergency Council For The Covid-19 Crisis (PECC) and PANDA. In particular, special thanks are due to Shahar Gavish, Ivan Iriarte, Todd Kenyon, Wilt Alston, Retsef Levi and Thomas Verduyn.
Bibliography
[1] Clinical Development Success Rates and Contributing Factors 2011–2020. https://go.bio.org/rs/490-EHZ-999/images/ClinicalDevelopmentSuccessRates2011_2020.pdf
[2] Clinical trial C4591001 entry in clinicaltrails.gov. https://clinicaltrials.gov/ct2/show/NCT04368728
[3] Emergency Use Autorization. December 11, 2020. https://www.fda.gov/news-events/press-announcements/fda-takes-key-action-fight-against-covid-19-issuing-emergency-use-authorization-first-covid-19
[4] Polack et al. Safety and Efficacy of the BNT162b2 mRNA Covid-19 Vaccine. N Engl J Med 2020; 383:2603-2615. https://www.nejm.org/doi/full/10.1056/NEJMoa2034577
[5] Pfizer-BioNTech COVID-19 Vaccine VRBPAC Briefing Document. December 10 2020. https://www.fda.gov/media/144246/download
[6] Biologics License Application (BLA) approval. August 23, 2021. https://www.fda.gov/media/151710/download
[7] Thomas et al. Safety and Efficacy of the BNT162b2 mRNA Covid-19 Vaccine through 6 Months. N Engl J Med 2021; 385:1761-1773. https://www.nejm.org/doi/full/10.1056/NEJMoa2110345
[8] Clinical Trial C4591001 Protocol. https://cdn.pfizer.com/pfizercom/2020-11/C4591001_Clinical_Protocol_Nov2020.pdf
Appendix
Statistical significance of SAE counts
In order to assess the statistical significance of the increment in SAEs among the vaccinated we apply a one-tailed Z-test for two proportions. This is a standard statistical test to check, based on event counts in two populations, the null hypothesis which is: the likelihood of an event to occur in one population is no greater than its likelihood in the other population. In our case, the event is a participant who has experienced at least one SAE in the period between dose 1 and up to one month after dose 2; the two populations are the vaccine and placebo arms; and the null hypothesis speculates there is no increment in the likelihood of SAEs among vaccinated people relative to unvaccinated people during this period.
The purpose of the statistical test is to assess what is the probability to obtain event counts as observed or more extreme (i.e. a greater increment in SAEs for the vaccinated) if the null hypothesis is true. This probability is called the p-value of the test. The lower the p-value, the less likely it is to obtain the observed results under the null hypothesis; and for extremely low p-values the null hypothesis is, statistically speaking, rejected. By rejecting the null hypothesis we accept the alternative hypothesis, that is: the vaccine does increase the likelihood of SAEs.
It is worth mentioning that no statistical analyses were reported in the VRBPAC Briefing Document based on the data listed in Table 6 (or the other two safety tables), even though the data covers a relatively large population (about 38,000 participants), with sufficient counts for AEs to warrant standard statistical tests: a total of 7,427 AEs in both vaccine and placebo arms, and a total of 184 SAEs.
As noted in the main text, the p-value assessment is only valid if the observed counts were obtained from a random sample. We will presume this to be the case here, even though as previously discussed there are sufficient reasons to suspect that this is not the case, and that the sample presented was artificially crafted in order to support conclusions advantageous to Pfizer.
Performing a one-tailed Z-test with the parameters as given in Table 6 (x1 = 103, n1 = 18801, x2 = 81, n2 = 18785) yields a p-value of 0.053 for the null hypothesis; i.e. it is highly unlikely (expected to occur in only about 5.3% of random samples of such magnitude) to observe such an increment in SAEs in the vaccine arm if the vaccine does not increase the probability of SAEs.
Although the Z-test p-value just barely misses significance at the 0.05 level, which is the standard threshold for rejecting the null hypothesis, adding a single SAE in the vaccine arm (104 cases instead of 103), or a single SAE reduction in the placebo arm (80 cases instead of 81) would trigger significance at p < 0.05. These or similar conditions might have occurred a few days before or after the selected data cutoff date, or with a sample containing only participants with a follow-up of one month after dose 2. (You will recall that this condition was met by 91.6% of the participants in the sample, which in addition included participants who were followed up for less than one month after dose 2.) This illustrates the danger of allowing post-hoc cherry-picking of report dates: one day’s difference could turn insignificant results into significant outcomes. In any event, although not statistically significant at the conventional 5% level, it is extremely close to being so. Especially given that this is a safety-related parameter, it should have been discussed in depth during the overall risk-benefit assessment of the vaccine.
Additional figures
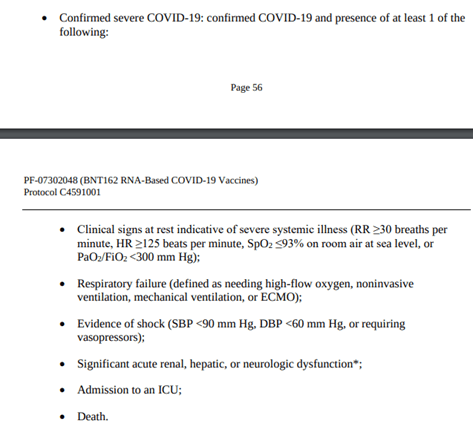
Figure A1: Severe COVID-19 protocol definition [8] (pages 56-57)
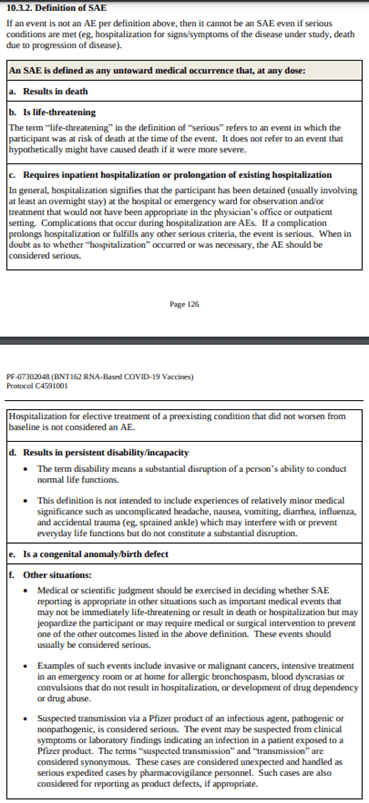
Figure A2: Serious Adverse Event protocol definition [8] (pages 126-127)
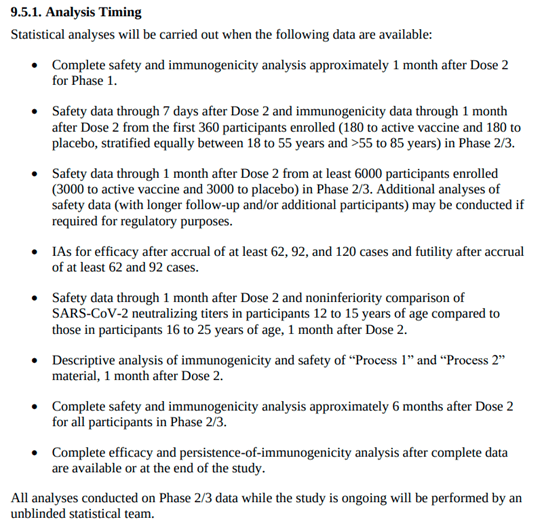
Figure A3: Protocol section 9.5.1. Analysis Timing [8] (page 114)